 首页
首页 400-620-6333
Nucleic Acid Electrophoresis Workflow—5 Main Steps

Gel electrophoresis is a part of many molecular biology experiments. Setting up nucleic acid electrophoresis involves a number of steps to achieve optimal separation and analysis of nucleic acid samples. As illustrated in Figure 1, key steps in the workflow of nucleic acid gel electrophoresis are:
1.Selecting and preparing gels
a.Agarose gels b.Polyacrylamide gels c.Buffer choice in gel preparation
2.Preparing standards and samples
a.Nucleic acid ladder selection b.Sample and ladder preparation c.Loading dye and buffer choice
3.Running electrophoresis
a.Running buffer choice b.Voltage c.Run time
4.Visualizing samples in the gel
a.Fluorescent stains b.UV shadowing
5.Documenting gels
a.Fluorescent imaging b.Autoradiography

Figure 1. Five key steps in nucleic acid gel electrophoresis.
1. Selecting and preparing gels?
Agarose and polyacrylamide are the two most common gel matrices utilized in the electrophoretic separation of nucleic acids. Both materials form 3-dimensional matrices with pore sizes appropriate for separation of nucleic acids and are nonreactive with the samples. The pore sizes can be adjusted by varying the percentage of the matrix, in order to efficiently resolve nucleic acids of different sizes.
The choice between agarose and polyacrylamide depends primarily on the size range and desired resolution of separation of nucleic acid samples, although gel casting and sample recovery methods may be considered (Table 1). Agarose forms matrices with pore sizes ideal for separating nucleic acid molecules in the range of 0.1–25 kb. Polyacrylamide, on the other hand, forms smaller pore sizes, which resolve nucleic acid molecules smaller than 1 kb. In some cases, single-base resolution between fragments of <100 bp may be obtained with polyacrylamide gels 1.
Table 1. Differences between agarose and polyacrylamide gels.
Agarose | Polyacrylamide | |
Source | Polysaccharide polymer from seaweed | Crosslinked acrylamide and bis-acrylamide |
Gel casting approach | Melt and solidify | Initiate chemical reactions |
Nucleic acid recovery | Melt and extract | Dissolve and diffuse, or electroelute |
DNA separation range | 50–50,000 bp | 5–3,000 bp |
Resolving power | 5–10 nucleotides | Single nucleotides |
a. Agarose gels
For gel preparation, agarose is commonly available as powders, although convenient preweighed tablets have also become available in recent years. To streamline the workflow and save time, precast agarose gels may be considered, which can be run, visualized, and analyzed as an integrated unit in certain commercially available systems.
To make your own agarose gels, the gel % is calculated as:
Gel % (w/v) = (grams of agarose / milliliters of buffer) x 100%
If a fluorescent nucleic acid stain is used, it may be included at a recommended concentration (e.g., 0.5 μg/mL of ethidium bromide) when casting the gel.
Table 2 provides recommended agarose gel percentages for the separation of DNA fragments of different lengths 2. In general, higher-percentage gels result in better separation and resolution of smaller fragments (Figure 2). Note that low-percentage gels can be fragile and difficult to handle, while high-percentage gels may be turbid and interfere with visualization.
Table 2. Recommended percentage of agarose gels for separation of DNA fragments.
Gel percentage | Range of efficient separation (bp) |
0.5 | 2,000–50,000 |
0.6 | 1,000–20,000 |
0.7 | 800–12,000 |
0.8 | 800–10,000 |
0.9 | 600–10,000 |
1.0 | 400–8,000 |
1.2 | 300–7,000 |
1.5 | 200–3,000 |
2.0 | 100–2,000 |
3.0 | 25–1,000 |
4.0 | 10–500 |
5.0 | 10–300 |

Figure 2. Mobility of DNA fragments in agarose gels of different percentages. The same DNA ladder was separated on 1%, 2%, and 3% agarose gels under the same conditions (including run time). The 1 kb fragment is indicated by red asterisks for comparison.
Fundamentals of agarose
Agarose is a purified form of agar, a carbohydrate structural component of the cell wall of marine red algae. Agarose is an unbranched (linear) polymer with a molecular weight of ~120,000, comprising 800–1,000 monosaccharides. Agarose chains consist of a repeating heterodisaccharide—namely, D-galactose and 3,6-anhydro-α-L-galactose linked by a β-1,4 glycosidic bond. The dissaccharide unit, also known as agarobiose, forms a chain connected by a-1,3 linkages (Figure 3).
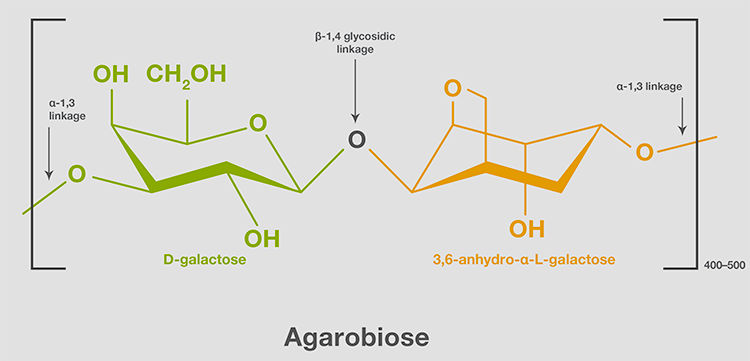
Figure 3. Structural unit of agarose. An agarose chain consists of 400–500 agarobiose units.
When an agarose solution is heated and cooled, it forms a gel matrix with pore sizes ranging from 50 to 200 nm in diameter, as governed by gel concentration. At a temperature above 90°C, agarose melts and becomes random coils. Upon cooling, two agarose chains form helical fibers linked by hydrogen bonds. Further cooling below the gelling point (usually <40°C) results in networks of helical bundles held together by more hydrogen bonds, forming a gel with three-dimensional meshes (Figure 4) 3,4. Because of the hydrogen bonds, gel formation of agarose is reversible by heat. Therefore, nucleic acids separated by electrophoresis can be extracted by melting gel slices containing fragments of interest.

Figure 4. Agarose structure in solution, changed by heating and cooling.
For extraction of DNA >10 kbp, agarose with a low melting point (LMP) may be a better choice. LMP agarose melts around 65°C (for a 1% gel), a relatively low temperature, enabling gentle extraction of very large nucleic acid molecules intact from the gels. LMP agarose’s low gelling temperature (~25°C) also makes it ideal for in-gel enzymatic reactions (e.g., ligation), where enzymes are active within a semi-solid agarose solution.
b. Polyacrylamide gels
Components of polyacrylamide—acrylamide and a crosslinking agent, bisacrylamide (also known simply as “bis”)—are available as powder, but premade stock solutions are common for convenient preparation of gels. The powder and liquid forms are known neurotoxins and should be handled with care using protective labwear. The total concentration of acrylamide plus bisacrylamide (expressed as %T) in a gel determines the pore size, which is usually 20–150 nm in diameter 5. The higher the percentage, the smaller the pore size, allowing resolution of smaller molecules. Table 3 shows commonly used gel percentages 2.
Table 3. Recommended percentages of polyacrylamide gels for separation of nucleic acid fragments.Denaturing gels are used to resolve single-stranded nucleic acids in their linear form (sizes indicated in bases), and nondenaturing gels are mainly used with double-stranded nucleic acids (bp = base pairs).
Polyacrylamide gel (with bis, at 19:1), % | Range of efficient separation |
Denaturing gels | |
4.0 | 100–500 bases |
5.0 | 70–400 bases |
6.0 | 40–300 bases |
8.0 | 30–200 bases |
10.0 | 20–100 bases |
15.0 | 10–50 bases |
20.0 | 5–30 bases |
30.0 | 1–10 bases |
Nondenaturing gels | |
3.5 | 100–1,000 bp |
5.0 | 80–500 bp |
8.0 | 60–400 bp |
12.0 | 50–200 bp |
15.0 | 25–150 bp |
20.0 | 5–100 bp |
For nucleic acid separation, polyacrylamide gels of 3–30% (%T) are routinely employed. In addition to %T, the weight percentage of bisacrylamide (crosslinker) to total acrylamide (%C) is critical to the pore size of polyacrylamide gels and sample separation (Table 4).
%T and %C can be expressed as:
%T (w/v) = [grams of (acrylamide + bisacrylamide) / milliliters of buffer] x 100%
%C (w/w) = [grams of bisacrylamide / grams of (acrylamide + bisacrylamide)] x 100%
Table 4. Common compositions of polyacrylamide gels?5.
Acrylamide:bis | %C | Relative pore sizes | Applications |
19:1 | 5% | Small | DNA and denaturing gels |
29:1 | 3.3% | Medium | ssDNA and RNA in nondenaturing gels |
37.5:1 | 2.7% | Large | Protein gels |
Fundamentals of polyacrylamide
Polyacrylamide is a polymer of acrylamide monomers often crosslinked with bisacrylamide, or N,N′-methylenebisacrylamide. The crosslinker, bisacrylamide, contains two units of acrylamide joined by a methylene bridge. Their polymerization is by free radical reactions—usually initiated by ammonium persulfate (APS), which can be catalyzed by TEMED (N,N,N′,N′-tetramethylethylenediamine) (Figure 5). Thus, the concentration of APS and/or TEMED determines the rate of polymerization at a given temperature.

Figure 5. Polyacrylamide formation with acrylamide and bisacrylamide structures shown. Bisacrylamide is two units of acrylamide connected by a methylene bridge (red).
c. Buffer choice in gel preparation?
Agarose and polyacrylamide gels are prepared using an ionic solution with electrical conductivity to enable nucleic acid mobility during electrophoresis. The same buffer type is usually used for both the gel and the running buffer during an electrophoretic run to maintain the same pH and ionic strength. The two most common buffers for nucleic acid electrophoresis are Tris-acetate with EDTA (TAE) and Tris-borate with EDTA (TBE), both with pH close to neutral to favor negative charges on the nucleic acids (learn more: Buffer selection in gel run).
For analysis of single-stranded DNA or RNA, agarose and polyacrylamide gels are often prepared and run under denaturing conditions. Denaturing conditions disrupt hydrogen bonds that may form between nucleic acids and thus reduce formation of secondary structures such as hairpin loops. Denaturing electrophoresis is therefore more routine for RNA separation and analysis. Common denaturing buffers used with agarose and polyacrylamide gels in nucleic acid electrophoresis include:
Agarose: Glyoxal and DMSO in sodium phosphate buffer, NaOH-EDTA buffer, and formaldehyde or formamide in MOPS buffer
Polyacrylamide: Urea in TBE buffer
2. Preparing standards and samples?
a. Nucleic acid standard selection
When running a gel, a reference sample containing nucleic acids of known sizes, often called a standard or marker or ladder, is included for size estimation of the samples of interest. Factors to consider when choosing an appropriate ladder for a given sample include:
Ladder type (i.e., DNA or RNA), fragment structure (i.e., single-stranded or double-stranded), and conformation (i.e., supercoiled, open circular, or linear), to ensure appropriate comparisons of migration
Number of fragments and their separation patterns for proper size estimation
Intended uses, such as whether the ladder is designed for qualitative analyses vs. accurate quantitative measurements
Suitability of the ladder for the type of gel used (e.g., some precast gels recommend specific ladders designed for optimal runs)
Nature of loading dyes, to avoid obscuring the bands of interest (Figure 6)
Compatibility of loading buffer with the gel used (e.g., salt concentration of the buffer may impact migration of the sample)
In the early days, DNA size standards were primarily derived from restriction digest fragments of viral genomes (e.g., lambda φX174) and bacterial plasmids (e.g., pUC19). These standards often had issues with reproducibility of digestion, sample purity, and banding patterns in electrophoresis. Later, ladders with fragments derived from ligation reactions and/or PCR came to be preferred for their reproducibility and generation of desired fragment sizes. Today, chromatographically purified fragments are considered the gold standard for ladders, since the technology provides higher control over quality, banding pattern, intensity, and quantity (Figure 6).

Figure 6. Differences inDNA ladders. Ladder #2 consists of chromatographically purified DNA fragments in an optimal loading buffer, resulting in bands of equal or desired intensity, lack of band smears, and absence of dye shadows. In contrast, ladder #1 was manufactured with an older technology and loaded in a buffer with suboptimal composition.
Today, ladders are also designed for stability at room temperature, for both shipment and storage, and for convenience and reduced environmental impact. Premixed, ready-to-use ladders are also available, where the ladders have been prepared with an optimal concentration of the loading dye to load directly onto the gels.
Note that ladders from different manufacturers with the same description (e.g., 1 kb or 100 bp) may not contain the same number, size, and intensity of DNA fragments (Figure 7). Before use, consult the accompanying guide and protocol from the manufacturer for accurate details of a ladder’s composition and its proper use.
In contrast to DNA ladders, RNA ladders are usually provided with a loading buffer containing a denaturant. Denaturants help maintain RNA in single-stranded form, allowing more predictable sample migration and separation results. When performing RNA gel electrophoresis, DNA ladders should be avoided, because their use under denaturing conditions can lead to atypical separation patterns due to separation of the double strands.

Figure 7. Differences in fragment composition of DNA ladders of the same description from two different vendors, A and B.
b. Sample and standard preparation
The amount of DNA that should be loaded onto the gel must be calculated to ensure the bands of interest are well separated for visualization and detection. Although 1–100 ng/band of DNA is usually sufficient for detection with a fluorescent dye, the minimal detectable quantity depends on the stain used 6. Note that overloading a sample or standard can result in smearing of bands and masking those nearby, resulting in poor resolution, particularly when the fragments are of similar sizes (Figure 8A).

Figure 8. Suboptimal sample separation. (A) The amount loaded affects band resolution. (B) A low volume of loaded sample may result in distorted bands.
Samples and ladders are prepared in a loading dye in a buffer such that the final volume will typically occupy at least 30% of the well volume. Using a smaller volume may result in band distortion, due to poor distribution in the well (Figure 8B). For samples containing DNA-binding proteins or cohesive ends, the mixture may need to be heated in a loading dye with SDS prior to gel loading, because protein binding and interaction between the DNA fragments may cause poor separation (Figure 10B).
c. Loading dye and buffer choice
Gel loading buffers (typically made as 6X or 10X stock solutions) are added to the samples (and the standard, when needed) in preparation for gel electrophoresis. Components of loading buffers include the following:
A density ingredient, such as glycerol or sucrose, increases viscosity of the samples, ensuring that the samples sink into the wells.
Salts, such as Tris-HCl, create environments with favorable ionic strength and pH for the samples. Loading buffers with high salt concentrations may produce broader or distorted bands and smears.
A metal chelator, such as EDTA, prevents nucleases present in the sample from degrading nucleic acids.
Dyes provides color for easy monitoring of sample loading, progress of the electrophoretic run, and often pH changes. Some loading buffers may contain more than one dye, to track migration of molecules of varying sizes in a sample more efficiently.
Typically, loading dyes are small and negatively charged molecules so that they migrate in the same direction as the nucleic acids. Some display pH-dependent colors, serving as pH indicators for samples during loading and running (Figure 9A). Commonly used dyes include bromophenol blue, xylene cyanol, phenol red, and orange G. When choosing a loading buffer, pay attention to the apparent migration of the dye(s) (Figure 9B, Tables 5 and 6) to avoid masking the nucleic acid bands of interest, especially if they have similar molecular sizes (Figure 9C). Dye masking makes analysis and quantitation of the desired bands problematic and less reliable.

Figure 9. (A) Dye colors at neutral pH. (B) Dye migration in various agarose percentages and in TAE and TBE buffers. (C) Dye shadow masking bands during visualization.
At times the loading buffer includes detergents or reducing agents, such as SDS, urea, and formamide, for denaturing. These additives can disrupt molecular interactions between and within nucleic acid molecules, promoting linearity or single-stranded conformation of the molecules. Samples should be heated with denaturants in loading dye to obtain optimal separation results (Figure 10A). For the electrophoresis of double-stranded DNA from enzymatic reactions, SDS may be added to the loading buffer to disrupt interactions between proteins and nucleic acids, in order to prevent alteration of sample mobility (Figure 10B).

Figure 10. Effects of heat and SDS on electrophoresis of samples.(A) RNA ladders in a denaturing buffer were loaded onto the gel without heat treatment. (B) DNA samples from a restriction digest and a ligation reaction were prepared in loading buffer with or without SDS. Samples in SDS were heated before gel loading.
Table 5. Apparent molecular sizes of bromophenol blue and xylene cyanol FF in agarose and polyacrylamide gels?2.
(A)Agarose gel in TBE and TAE buffers
| Xylene cyanol FF | |||
Gel % | TBE | TAE | TBE | TAE |
0.5 | 750 bp | 1,150 bp | 13,000 bp | 16,700 bp |
0.6 | 540 bp | 850 bp | 8,820 bp | 11,600 bp |
0.7 | 410 bp | 660 bp | 6,400 bp | 8,500 bp |
0.8 | 320 bp | 530 bp | 4,830 bp | 6,500 bp |
0.9 | 260 bp | 440 bp | 3,770 bp | 5,140 bp |
1.0 | 220 bp | 370 bp | 3,030 bp | 4,160 bp |
1.2 | 160 bp | 275 bp | 2,070 bp | 2,890 bp |
1.5 | 110 bp | 190 bp | 1,300 bp | 1,840 bp |
2.0 | 65 bp | 120 bp | 710 bp | 1,040 bp |
3.0 | 30 bp | 60 bp | 300 bp | 460 bp |
4.0 | 18 bp | 40 bp | 170 bp | 260 bp |
5.0 | 12 bp | 27 bp | 105 bp | 165 bp |
(B)Polyacrylamide gel in denaturing and nondenaturing buffers
Acrylamide:Bis (19:1), gel % | Bromophenol blue | Xylene cyanol FF |
Denaturing gels | ||
4.0 | 50 bases | 230 bases |
5.0 | 35 bases | 130 bases |
6.0 | 26 bases | 105 bases |
8.0 | 19 bases | 75 bases |
10.0 | 12 bases | 55 bases |
15.0 | 10 bases | 40 bases |
20.0 | 8 bases | 28 bases |
30.0 | 6 bases | 20 bases |
Nondenaturing gels | ||
3.5 | 100 bp | 460 bp |
5.0 | 65 bp | 260 bp |
8.0 | 45 bp | 160 bp |
12.0 | 20 bp | 70 bp |
15.0 | 15 bp | 60 bp |
20.0 | 12 bp | 45 bp |
3. Running electrophoresis
Electrophoresis is carried out following the preparation of gels, standards, and samples. The gel must be completely solidified before removal of the comb and addition of the running buffer. The gel comb should be lifted upward, smoothly and steadily, to avoid tearing the gel and distorting the wells. After buffer addition and comb removal, care should be taken to remove air bubbles that may be trapped in the wells. For polyacrylamide gels, the wells should be thoroughly rinsed with buffer to remove residual unpolymerized acrylamide.
Horizontal gels should be oriented in a gel box so that sample wells are on the side of the negative electrode to move samples towards the positive electrode when electrophoresis starts (Figure 11A). This orientation may be memorized as “run towards the red” since the positive electrode is commonly coded red. Vertical gel boxes are designed with wells located at the top (Figure 11B).

Figure 11. Gel setups in horizontal and vertical electrophoresis systems. The arrows indicate the direction of nucleic acid migration in electrophoresis.
a. Running buffer choice
A running buffer, which is an ionic solution with buffering capacity, is routinely used in gel runs to allow current flow while impeding pH changes that may occur. During electrophoresis, the negative electrode becomes more basic and the positive electrode more acidic because of electron flow, resulting in electrolysis of water and shifts in pH (Table 6). Release of hydrogen and oxygen gases causes bubbling from the electrodes, a telltale sign of a running gel. Ideally, the running buffer and the gel preparation buffer should be the same to ensure efficient conductivity.
Table 6. Chemical reactions and pH changes at the two electrodes.
Electrode | Negative (–) | Positive (+) |
Electron flow | In | Out |
Chemical reaction | 4 H2O + 4 e–?→ 2 H2?(gas) + 4 OH– | 2 H2O?→ O2?(gas) + 4 H+?+ 4 e– |
pH changes | Basic | Acidic |
The choice of buffer for electrophoresis depends on sample sizes, run time, and post-electrophoresis processes, with Tris-acetate EDTA (TAE) and Tris-borate EDTA (TBE) being the two most common buffers (Table 7) 2,7.
TAE is a better choice for fragments of >1,500 bp, which tend to smear less in this buffer. Due to its lower buffering capacity, TAE is more suitable for shorter electrophoretic runs (e.g., <2 hr). Longer gel runs in TAE may lead to overheating, sample denaturation and/or diffusion, and possibly gel melting, because of low buffering capacity.
TBEhas a higher buffering capacity, making it less likely to overheat and thus better suited for longer runs. TBE works better for the separation of shorter fragments, but dsDNA may migrate more slowly in TBE. TBE can inhibit enzymes and therefore may not be suitable for downstream applications involving enzymatic steps, such as restriction digestion, cloning, and PCR.
Using a buffer with ionic strength higher than 1X TAE or 0.5–1X TBE may move the samples faster but likely will generate a large amount of heat due to high conductivity, resulting in sample denaturation and damage to the gel.
Table 7. Buffer selection guide.
Buffer | Advantages | Disadvantages | Nucleic acid resolution | |
DNA | RNA | |||
TAE |
| More prone to overheating | >1,000 bp | >1,500 bases |
TBE |
| Inhibits enzymes, making it unsuitable for downstream enzymatic steps (e.g., cloning) | <5,000 bp | <1,500 bases |
Gels should be completely submerged in buffer to allow ion flow and prevent gel drying (Figure 12A). However, when running a horizontal gel like an agarose gel, the depth of buffer over the gel should be no higher than 3–5 mm. Excess buffer over the gel (>5 mm) may result in decreased nucleic acid mobility, increased band distortion, and overheating.

Figure 12. Effects of running buffer on electrophoresis.(A) The top portion of the gel was not submerged during electrophoresis. (B) The gel was run in a buffer with lower salt concentrations than recommended, which was different from the buffer used in gel preparation.
Note that the running buffer of denaturing agarose gels may be neither TAE nor TBE, since these gels may be made in a different buffer, such as sodium phosphate and MOPS. It is important to select a running buffer that is compatible with the gel used (Figure 12B).
b. Voltage
To start running a gel, an electrical potential is applied across the gel with constant voltage, current, or power. Constant voltage is commonly employed in nucleic acid electrophoresis, with voltage typically set at 5–10 V/cm.
Voltage to be applied (V) = distance between the electrodes (cm) x recommended V/cm
The voltage may be adjusted according to the size of the DNA fragments to be separated, as well as the type of running buffer used (Table 8). Recommended voltages are usually provided with commercially available nucleic acid ladders, for optimal separation of the fragments in each product. Note that very low voltage slows the migration of the nucleic acids, which may result in diffusion of small molecules and low resolution (Figure 13A). On the other hand, when the voltage is too high, poor separation and smearing of samples may occur; in some instances, overheating of the buffer, “smile bands,” and even denaturation of the samples may ensue (Figure 13B).

Figure 13. Effects of voltage on DNA electrophoresis. (A) Low voltage results in poor band resolution and diffusion. (B) High voltage can cause “smiling”.
Table 8. Run conditions based on fragment size?2.
Size of the DNA | Voltage | Optimal running buffer |
<1 kb | 5–10 V/cm | TBE |
1–5 kb | 4–10 V/cm | TAE or TBE |
>5 kb | 1–3 V/cm | TAE |
Up to 10 kb | Up to 23 V/cm | TAE |
In some cases, a temperature probe may be connected to the gel apparatus to help control cooling and heating of the buffer. For electrophoretic runs >2 hr, cooling and recirculating the buffer may improve separation of the samples. For denaturing gels, allowing the buffer to heat up to 55°C may improve results by enhancing single-stranded forms of nucleic acids.
c. Run time
The length of the gel, the voltage used, and the sizes of the molecules in the sample will determine the amount of time needed for electrophoresis. Usually, electrophoresis is run until the band of interest has migrated 40–60% of the gel length. At specific time intervals during the gel run, the relative positions of the loading dyes may be observed, until the bromophenol blue dye has migrated approximately 60% of the gel length and/or the orange G dye has migrated 80% of the gel length. Most importantly, run time should be monitored to ensure the smallest molecules in the samples or standards do not migrate off the gel. Note that run times shorter than necessary will not be sufficient to completely resolve the bands (Figure 14). DNA ladders containing?tracking dyes that run behind and ahead of the samples?are available to help monitor gel runs, as well as to ensure that bands of interest are not masked by the dyes.

Figure 14. Effects of run time on sample separation.
4. Visualizing samples in the gel
After a gel run is complete, the samples need to be visualized. Since nucleic acids are not visible under ordinary ambient lighting, a detection method is required for visualization. As described in Table 9, available methods offer differing ranges of sensitivity and benefits in sample detection 6.
Table 9. Common nucleic acid gel stains and detection methods.
Stain | Benefits and considerations | Sensitivity for detection (approximate dsDNA amounts) |
Colorimetric | ||
|
| 0.5–1 μg |
Fluorescent | ||
| 25 pg–1 ng | |
Radioactive | ||
|
| 10 fg–1 ng |
a. Fluorescent stains
Among available stains, fluorescent dyes are most widely utilized in sample detection (Figure 15) due to their ease of use and high sensitivity. When excited with an appropriate wavelength, the dyes emit visible light (i.e., fluoresce). The intensity of fluorescence correlates to the amount of nucleic acid bound, which is the basis for detection and quantitation of nucleic acids in electrophoresis.

Figure 15. Different types of nucleic acid–binding dyes.
Ethidium bromide (EtBr) is a fluorescent dye commonly used in nucleic acid electrophoresis because of its short staining time (~30 min) and high sensitivity (detects ~1 ng of double-stranded DNA per band). Nevertheless, an alternative dye may be considered for the following reasons:
Mutagenicity and disposal: Ethidium bromide is highly mutagenic, so fluorescent dyes that are less hazardous and do not require special disposal offer a safer workflow in nucleic acid electrophoresis (Figure 16).
Sensitivity: Fluorescent dyes that are higher in sensitivity than EtBr are better suited for detection of low amounts of samples (Figure 16). Single-stranded nucleic acids often require more samples and/or an intercalating dye for visualization because there is less base stacking. Therefore, dyes that preferentially bind to single-stranded nucleic acids are good alternatives for sample detection in RNA electrophoresis.
UV damage: Fluorescent dyes that can be excited with lower-energy blue light instead of UV light cause less structural damage to nucleic acids but detect with equal or higher sensitivity (Figure 17A). As such, excitation with blue light in electrophoresis can improve success in downstream applications like cloning and sequencing (Figure 17B).

Figure 16. Ethidium bromide alternatives with enhanced features.

Figure 17. (A) Excitation and emission spectra of common nucleic acid stains. The stains are excited most efficiently at a particular wavelength called the excitation maximum. SYBR Safe and SYBR Gold stains can be excited maximally by blue light and to a lower extent by UV light. (B) Cloning efficiency after indicated exposure times using blue light (for SYBR Safe stain) or UV light (for ethidium bromide), for visualization of the cloning insert during electrophoresis. Cloning efficiency of the gel-purified lacZ fragment was measured by the number of blue colonies formed on the X-Gal plates, which indicates insertion of the functional (unmutated) gene into the vector.
b. UV shadowing?
In place of staining with a dye, nucleic acids may be indirectly visualized by a method call UV shadowing, taking advantage of UV absorption by nucleic acids 8. It is commonly used for separation and purification of oligonucleotides and RNA by electrophoresis, where simple detection is sufficient and/or use of intercalating dyes could impact downstream applications. For detection by UV shadowing, nanograms to micrograms of samples are needed, and a thin and transparent gel like polyacrylamide should be used to ensure UV absorption and transmission. In a UV shadowing protocol, the gel is removed from the cassette after electrophoresis to maximize detection, wrapped in clear plastic film for protection, and then placed on a UV-fluorescent thin layer chromatography (TLC) plate. When the gel is exposed to UV radiation, absorption by the nucleic acid bands casts shadows on the TLC plate (Figure 18). The shadowy areas of the gel of desired sizes are cut out for further processing.

Figure 18. UV shadowing to visualize separated fragments.
5. Documenting gels
a. Fluorescence imaging
After visualization, nucleic acid gels are typically documented for record and analysis of electrophoresis results. If samples are stained with a fluorescent dye, special equipment is required to excite the dye with an appropriate light source to both visualize and capture a gel image. An excitation light source may be above the gel, called an epi-illuminator (similar to a handheld UV lamp), or below the gel, called a transilluminator (Figure 19). Since the light source is farther in the epi-illuminator setting, the samples are subjected to less energy. This can lessen UV damage to the nucleic acids but may also lower the signal of the gel bands. A transilluminator, on the other hand, provides higher signal for the bands but may increase UV-induced damage due to the proximity of the radiation to the gel.

Figure 19. Epi-illumination and transillumination.
b. Autoradiography
For electrophoresis of radiolabeled nucleic acids, the gel is exposed to X-ray film after electrophoresis for documentation, a process called autoradiography. The intensities of radiolabeled bands may be measured by densitometry for quantitation.
In conclusion, nucleic acid electrophoresis workflows employ a number of steps and reagents to separate and analyze samples. Choosing the right tools for your samples, as well as recognizing workflow advantages and disadvantages, can significantly improve the results of electrophoresis in molecular biology applications.
References
1.Stellwagen NC (1998) DNA Gel Electrophoresis. In: Tietz D (editor),?Nucleic Acid Electrophoresis (Springer Lab Manual). Heidelberg: Springer. pp 1–53.
2.Green MR, Sambrook J (2012) Analysis of DNA. In:?Molecular Cloning: A Laboratory Manual?(4th ed). Cold Spring Harbor: Cold Spring Harbor Laboratory Press. pp 81–156.


 危险品化学品经营许可证(带存储)